RDMW-2022 Help
Making the most of RDMW-2022
Now that you’ve downloaded Radio Data Medium Wave (RDMW) you undoubtedly want to make the most of its capabilities. If you have clicked HELP! you have come to the right place.
Getting started
The very first thing you’ll see is a pink start screen which allows you enter the frequency you want and to select the day part. You can then create a map at the click of a button. The map will open in a new tab on your web browser. That means you can open up several maps at once, in separate tabs, perhaps to compare frequencies or to flip between day/night maps.
You will have received 284 maps in total. The best way to select frequency and time frame is to use the RDMW-Start.html file. Just open this using an internet browser like Chrome, Firefox, or Safari. PLEASE NOTE THERE MAY BE SOME BEHAVIOUR DIFFERENCES BETWEEN BROWSERS. The information here assumes you are using Google Chrome.
What can you find on a map
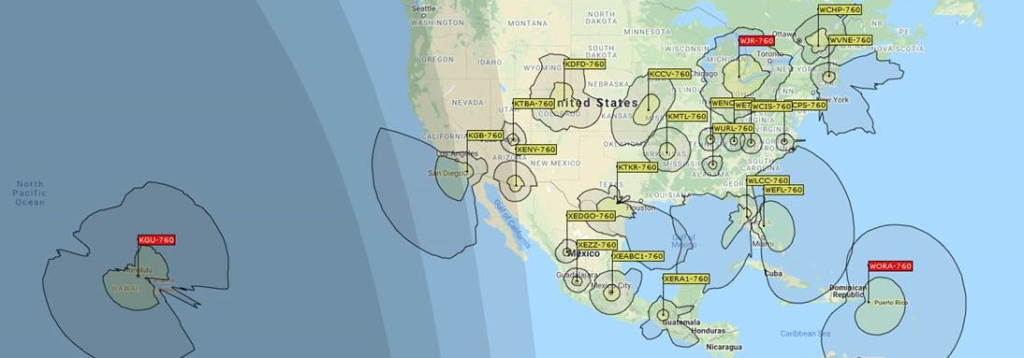
New to RDMW-2022: A map shows every station in North America that we have been able to map. For the first time RDMW 2022 includes stations in Mexico and parts of the Caribbean. There is a unique map for each frequency and for each daypart.
Each map is topped by a simple control bar that contains buttons to control map functions and boxes where you can enter the location of your receiver

Elsewhere on the map you will see controls that are part of Google maps and you will also see a help button in the bottom left corner, which will bring you here.
When you first open a map North America will appear in the centre of your screen. You can of course can scroll and zoom the maps exactly as you would any other Google Map.
When maps are first opened you will see pins on the map showing the location of every station on the channel. You will also see the radiation patterns surrounding the pins. This may seem confusing if there are too many overlapping patterns but they can be switched off with ![]() and on with
and on with ![]() control buttons located in the control bar.
control buttons located in the control bar.
Most stations are surrounded by a coloured/shaded areas that indicate the primary coverage area of a station. On daytime maps you’ll see an inner and outer contour which represents two different signal strengths. The smaller inner contour represents stronger reception and the outer contour weak signal reception. The shape of the coverage area depends on the directional pattern of the antenna and ground conductivity for daytime maps, and skywave propagation for nighttime maps.
New to RDMW-2022: Each map has a real-time overlay that shows where night and day are located on the earth’s surface. This will help you select the most appropriate map for your consideration. You can switch this overlay on or off using the ![]() button. When you toggle to re-draw the greyline, the current GMT will be applied.
button. When you toggle to re-draw the greyline, the current GMT will be applied.
Using the Google Map controls you can switch between map, terrain and satellite view and you can zoom in all the way to see the radio station antenna masts.
New to RDMW-2022: The number of available maps has been extended to cover 518kHz and 490kHz which are the MW Navtex channels in use in North America.
Adding a receiver location
Once you add your receiver location then RDMW is able to create ray traces from each transmitter to your receiver. In RDMW you can control your receiver location in several ways.
From the start page (pink screen) you should set your Master Receiver Location by entering your latitude and longitude. This location is stored even if you close RDMW and your web browser and it will be ready for you next time you use RDMW. You can over-write the stored figures anytime and the new figures will then be saved. Remember latitude and longitude is in decimal format with negative figures for western or southern hemispheres. e.g. the Statue of Liberty in New York is at 40.68913, -74.044500.
New to RDMW-2022: Additionally whilst you are using RDMW you might want to experiment with different receiver locations. Whilst you are looking at the maps you can temporarily change the receiver location using a Session Location. These Session Locations are only stored for the duration of your browsing session. When you close RDMW & your browser the Session Location will be forgotten.
There are two ways to enter your Session Receiver Locations. You can of course change to any receiver location in the world.
Option 1: If you know the exact location you can type the latitude & longitude into the ![]() boxes in the top left of the black control bar. Then hit the set button
boxes in the top left of the black control bar. Then hit the set button ![]() and your location is stored.
and your location is stored.
Option 2: You can use use your mouse to pick any location on the map to be your receiver location. Just hold down your keyboard Ctrl key and then click your mouse. RDMW will automatically remember your selected location. You can move your receiver by repeating this on a different point on the map.
As you step-tune the frequency or change the daypart RDMW remembers your Session Location.
If you don’t use the Session Location RDMW defaults to using your Master Receiver Location.
Once you add your receiver location then the map is able to create ray traces from each transmitter to your receiver. You will be able to see the shortest path the signal would take to reach you and the Great Circle distance is calculated and displayed in the flag information for every station. If you have the coverage plot and ray trace shown at the same time you will be able to see the relative strength of the signal heading in your direction. Just as you can control coverage plots you can switch ray traces on and off using these controls ![]() .
.
If you decide not to enter your Master Receiver Location or use a Session Location then the ray tracing function on the maps will not work as it doesn’t know where to aim the ray from the transmitter. Please also note that different browsers (e.g. Chrome/Safari/Firefox/Edge) work in different ways and when you store receiver location it won’t be transferred between different browsers.
Controlling your maps
RDMW is a powerful tool and allows you to customise the display by switching coverage plots on and off. You can do this for all stations on a map or individually. To control an individual station just click on the flag on the pin showing the station name or callsign.
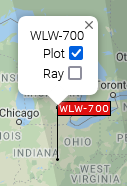
You have the same degree of control on ray traces. So if you are trying to see if reception of a particular station is possible you can display just its coverage plot and ray trace – with out the clutter from 100 or more other stations on the same frequency.
New to RDMW-2022: we have added a simple step tuning in the control bar where you can step up/down channel by channel ![]() . Please note that tuning is in 10kHz steps, so stations not on 10kHz steps are included on the step below. For example 518kHz Navtex is found on the 510kHz step, KTWG-801 is in the 800kHz step and KGUM-567 is in the 560kHz step.
. Please note that tuning is in 10kHz steps, so stations not on 10kHz steps are included on the step below. For example 518kHz Navtex is found on the 510kHz step, KTWG-801 is in the 800kHz step and KGUM-567 is in the 560kHz step.
New to RDMW-2022: We have also added a day-part selector ![]() that makes it easy to stay on one frequency and switch between day/night maps.
that makes it easy to stay on one frequency and switch between day/night maps.
If you are familiar with Google Maps you will understand how to control your position on earth, and how to vary your level of zoom. When you zoom into a transmitter site you can switch to “Satellite” view to see the transmitter mast viewed from space. Furthermore you can use Street View to get a high resolution image of the transmitter facilities in most locations. Just drag the orange Pegman to a road on the map or click on the orange Pegman. If you’d like to view maps as big as possible on your computer display just use the F11 keyboard shortcut to toggle in/out of full-screen.
New to RDMW-2022: If you find yourself with a blank screen you may be lost in the polar wilderness of Google Maps or zoomed in and adrift in an unknown ocean. Don’t panic, just click the home button ![]() to return to a map centred on your receiver location.
to return to a map centred on your receiver location.
Understanding data
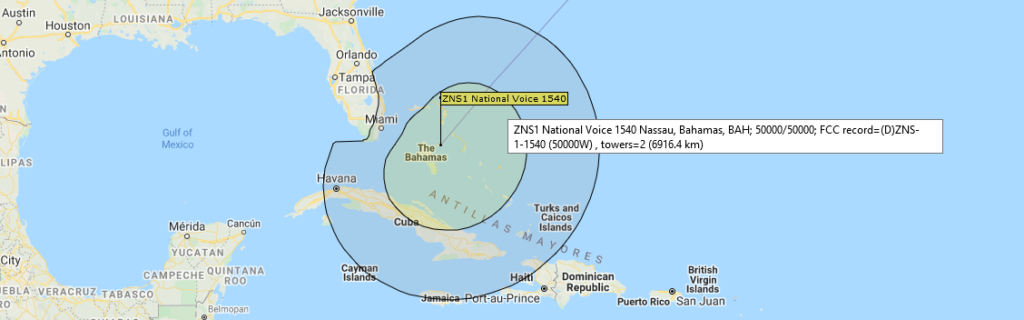
Each station shows a small map pin with a coloured flag. Because it is small the flag can only show the station name or callsign/frequency. If you use your mouse to hover over the flag you will see more details such as transmitter power (day/night), number of towers, station location and the unique calculated distance to your receiver in km. If data has been extracted from the FCC database you will also see “FCC record=”.
You may also see other special phrases in the expanded flag text with particular meanings as follows:
- ?location? = uncertainty about exact lat/long of antenna; may be too new to appear on Google Maps or Street View. Or ambiguity between various data sources. Or we have been unable to locate it on Google Maps.
- ?status? = uncertain whether station is on air. It may be new and not yet operational, or it may have fallen silent. It could be a 24hour station operating intermittently or on a reduced schedule
- ?callsign? = possible callsign changes as yet unconfirmed
- ?planned? = station has a reasonable chance of activating the frequency in the near future; planned stations may also have uncertain location.
- ?testing? = station has built facilities and is testing prior to operation or after repair
- ?unlisted? = station for which no official listing, registration can be found but has been heard on air. It may be an admin error, unauthorised or a pirate.
You will also notice that station flags are colour coded to aid understanding. The colours mean:
- red = unlimited stations (24 hr operation). These stations never switch broadcast patterns. Many old timers here, including most US clear channel stations.
- yellow = daytime operation of a station (this includes stations that change between day & night, as well as those that only broadcast during the day).
- black = nighttime facilities of a station that are different to their daytime facilities
- grey = critical hours facilities of a station that are different to their daytime facilities
New to RDMW-2022: In the example above the pin and flag is very clear but on some frequencies (especially the so-called “graveyard channels” of 1230, 1240, 1340, 1400, 1450 and 1490kHz) there are so many stations that you may see overlapping flags. To aid readability you can use your mouse to right click on any flag to send it to the back of the pile allowing you to read other obscured flags.
Frequently asked questions
Why do I get a “File Not Found” message?… This can happen if you enter a frequency incorrectly in the Start Screen (e.g. if you type “1010kHz” rather than “1010”. It will also happen if you select a Critical Hours map where no stations are operating, because such a map does not exist. Critical Hours stations only operate on 44 MW frequencies. If you get this message just use the back button on your browser to return to where you came from.
Why do some stations not show coverage plots?… Some stations don’t show a coverage plot and this is because we lack the data that allows RDMW to compute the plot.
Why are some nighttime plots so small?…. This is because the station is too low power for RDMW to plot. For some low power stations, below ~1500W, the skywave mV/m cutoff of 0.1 mV/m is not met at any compass point around a station. In other words, it never generates a 0.1 mV/m signal via skywave at 50% of the receiving time at any compass point. In this case the station’s groundwave plot is substituted.
Why do Mexican border blasters have odd coverage patterns?… Some have deliberate directional patterns to reach an audience in the USA (like XEPRS 1090 out of Rosarito). But other patterns are affected by a strange data anomaly. RDMW uses earth conductivity to calculate the range a groundwave daytime signal will travel, but for some reason ground conductivity figures are differently recorded north & south of the US-Mexico border. This gives the illusion on some daytime plots of greater coverage on the US side.
Why do Canadian stations have greater daytime coverage than Mexicans?… Assuming the same power, antenna performance and similar ground conditions there is no coverage difference. However the map is based on the Mercator projection which exaggerates the area on a flat screen the farther north one goes.
Why do Caribbean stations have such good daytime coverage?… It is all because of the sea. Most islands are small and many transmitters are located very close to salt water.
Are the plots accurate?… RDMW relies on data from many sources, in particular the FCC in the USA, Industry Canada and the IFT in Mexico. The best data for ground conductivity and the best computational tools have been used to generate plots. However many days of human checking has been applied to verify data and to resolve as many discrepancies as possible. Exact transmitter sites have been found visually on Google Maps and Google Street View to increase location accuracy and to validate the number of masts in place. Publications by DX clubs (MWC, IRCA, NRC) have been consulted for recent changes and to confirm if stations have been actively heard on air. In certain territories, despite our best efforts it is extremely difficult to validate data. Navtex data comes from several primary sources. Sadly the internet is plagued by out of date “data” still being visible and even the FCC never cleans the data in its databases. If you spot errors that can be confirmed, please let us know. Please note that the data in RDMW is a snapshot in time, and station data is always in a state of flux – to keep up to date with changes subscribe to and read Medium Wave News.
Why are there three levels of sunset/sunrise?… Greyline propagation, or propagation along the earth’s sunrise/sunset terminator, is very noticeable and can lead to long distance reception (MW DX). The night/day overlay shows the width of the earth’s terminator and its transition from total darkness to the sunrise and sunset edge. The actual sunrise or sunset point is the edge where the overlay disappears. The lightest band of the overlay is civil twilight, where the sun is just below the horizon to a point 6 degrees below the horizon. The next darkest band is nautical twilight, where the sun is between 6 degrees and 12 degrees below the horizon. The next darkest band is astronomical twilight, where the sun is between 12 degrees and 18 degrees below the horizon. The darkest area is where total darkness exists, where the sun’s position is greater than 18 degrees below the horizon.
Why can I see a radio mast in Google Maps satellite view but not in Street View (or vice versa)?… Assuming Street View is active at the mast location (not so in all countries) you should see the same but from a different point of view. However the dates of the imagery can vary considerably (in Mexico for example much Street View is 2014/15 and earlier, but the satellite view is much more recent) and this can be very confusing if stations have moved location or changed their transmitting facilities. Some city centre MW transmitter sites have been sold in recent years for prime real estate development and stations have relocated.
Why are so many Caribbean countries missing?… Many of the smaller island nations have lost their MW broadcasters over recent years so we have nothing to show. Several had high power stations dependent on foreign funding whilst local state or commercial broadcasters on tight budgets have moved to FM. A few unused masts are still standing; perhaps they might be reactivated someday? Cuba and the Dominican Republic are both active on MW but validating information is difficult and obtaining coverage mapping data mostly impossible; these may be subject for future releases of RDMW.
For the technical specialists
Skywave plots
Nighttime maps show expected skywave coverage patterns. These represent the standard SS+6 (sunset plus 6 hours at the transmitter site), 50% signal probability of 0.1mV/m (40 dBu) field strength. Note also that nighttime reception of signals out to and beyond the depicted pattern is very possible, and in fact quite likely for a skywave signal. The maps represent a signal strength at the fringe level. We chose this signal level to give a good representation of what is possibly received by most DXers on an average evening. For skywave signal maps, predicted signal levels are calculated in accordance with current FCC or ITU methods of recent years (1999 onward).
As of 2019, the skywave calculation has been totally overhauled and enhanced to more reflect actual signal expectations across the U.S. at night. The fact of life is that pattern overlay occurs on many frequencies. A DXer can often separate overlapping signals using directional receiving aerials. Simply select the plots you want to analyze. Check the ![]() checkbox to turn off all plots. Click any station flag and check the box to plot that station then click
checkbox to turn off all plots. Click any station flag and check the box to plot that station then click ![]()
You will occasionally see a skywave plot which looks much smaller than surrounding plots. This is a case where the station’s skywave signal did not meet the mV/m threshold (0.1 mV/m). The groundwave plot level is substituted in this case. The station does in fact have a skywave component, however small, it will be measurably less than the 0.1 mV/m level (very weak). It may be receivable!
The darker line defining the outer edge of the skywave plot shows the location of the 0.1 mV/m signal point at all compass points. Be aware that skywave signal strength does not decrease linearly with distance from the station. From the station outward, the signal strength will generally increase to a point usually 200-400 kilometers distant where it will peak, then decrease somewhat linearly from there.
Also note that the atmospheric background noise level on the medium wave band is generally considered to be approximately 36 dBu (dBu in this case = dBµV/m), equivalent to 0.063 mV/m. Signals below that level will not be heard unless they fade up above the noise. A gain or directional antenna can be used to increase signal strength while limiting or even reducing the overall atmospheric background noise level.
The following parametrics are considered in the skywave calculation:
- Hourly transitional loss variance from sunset to sunrise.
- Seasonal gain or loss, January – December.
- Diurnal enhancement at the sunrise and sunset period.
- Winter daytime skywave enhancement (only on maps created for times during the day).
- Daily seasonal nighttime skywave enhancement..
Ground wave plots
The daytime maps show expected ground-wave coverage patterns at two levels, out to the 1.0mV/m and 0.1mV/m field strength contours (60 dBu and 40 dBu respectively). These levels were chosen to closely match those which might be helpful to the MW DXer. For daytime signal maps, Radio Data MW generates a real pattern plot based on transmitter power, antenna array efficiency and directivity, ground conductivity and ground dielectric constant of the path to the receiver. Increased conductivity of water paths over the Great Lakes (freshwater) and the oceans (salt water) are also accounted for. It is exceptional to find a program that takes all these factors into account.
The exception is where ground wave coverage extends over land further south than Mexico & the Caribbean since RDMW lacks data on ground conditions in these areas.
Critical Hours
On 44 frequencies a small number of stations operate with facilities that are different from their daytime and nighttime facilities. So one station can have three different coverage plots in one 24 hour period! The FCC defines Critical Hours as the first two hours of daylight after sunrise and the last two hours of daylight before sunset.
Night/day overlay
The night/day overlay gets UTC from a software call to Javascript. Javascript, calculates UTC from your computer clock, as it knows the time difference in local hours to UTC. So you must have your computer clock set correctly and with the proper time zone. Long story short, the night/day overlay is always synced to UTC (at map page load time). The overlay is static until you refresh the page, where it will move to its new position.
Anomalies
Despite our best efforts to clean & validate data there will always be a few anomalous plots in RDMW. Some stations known to be silent are still included if we think there is a reasonable chance they will return. Of course they might never return or they might return at a different location; WFME 1560 is an example.
Conversely there may be stations on the air that are not listed in official databases. We have included Radio Marti 1180kHz even though its facilities and radiation pattern are carefully omitted from the FCC database; the FCC lists stations in other countries outside its jurisdiction but decides to omit a Florida station radiating upwards of 200kW towards Cuba.
Another obvious plot anomaly is Shine 800 from Bonaire, which is the most powerful MW transmitter in the Americas – it also has a complex antenna pattern that changes three times a day – unfortunately we don’t have the data to try to plot its pattern.
Stations with red flags are those designated by the FCC as “unlimited” using one set of transmission facilities day and night – mostly 50kW formerly “clear channel” stations. But to confuse matters there are many other stations that use the same facilities day & night but are just not classified in the same way. These are listed as separate day & night facilities even though their parameters may be the same.
Transmitter locations
Much site data has been recorded historically as latitude and longitude in degrees: minutes: seconds but we are working in degrees and decimal subdivisions. Often there has been some rounding applied to the original data and much data in the FCC records has been recorded before GPS measurement tools became commonplace. For example a location of 40°20’N 100°10’W translates to 40.333333, -100.166667 giving a spurious degree of accuracy. Manual checking of transmitter locations using satellite images on Google Maps reveals discrepancies in FCC data of anywhere up to 400m which we had to live with to avoid breaking the mapping tool. We have tried to eliminate these discrepancies where we are not dependent on FCC data.
If you have access to reliable or primary data about any North American stations that would help us improve RDMW please do contact us at the Medium Wave Circle.
Browsers
Please note that RDMW was developed in the Google eco-system of Chrome & Google Maps. It has also been extensively tested during development with Firefox. There are difference between the way these (and other browsers) work, particularly with handling off-line website data. Although most internet usage these days is on mobile & smartphones, we have designed RDMW to take advantage of the large screens found with desktop computers. RDMW has been tested on Apple Mac computers but does not work on ipad/iphone.
Latest revision date: 24 October 2021; FCC database extract 19/10/2021